
この記事では、Googleスプレッドシートで管理している階層データを、D3.jsを使ってブラウザ上にツリー構造で可視化する方法を解説します。
表示イメージ
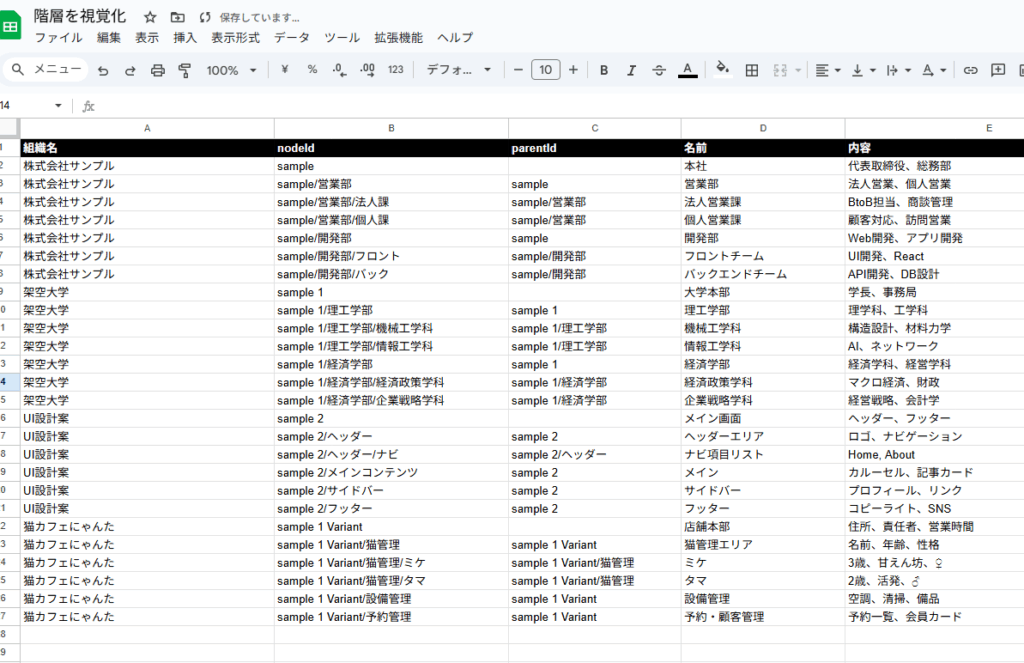
スプレッドシート
元データの例です。
スプレッドシートの情報を元に階層表示
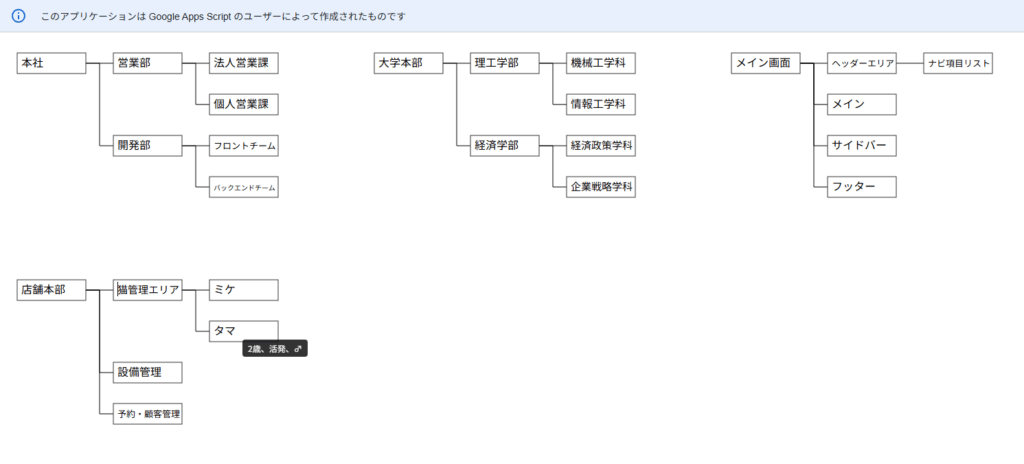
多階層のデータ構造にも対応しています。
また、ノードをホバーした際に補足情報をツールチップで表示する仕様にしています。
目次
スプレッドシートの作成
まず、階層構造を定義するスプレッドシートを用意します。
構成例は次のとおりです。
| グループ名 | nodeId | parentId | ノード名 | 補足情報 |
|---|---|---|---|---|
| 猫カフェにゃんた | sample | 店舗本部 | 住所、責任者、営業時間 | |
| 猫カフェにゃんた | sample/猫管理 | sample | 猫管理エリア | 名前、年齢、性格 |
| 猫カフェにゃんた | sample/猫管理/ミケ | sample/猫管理 | ミケ | 3歳、甘えん坊、♀ |
| 猫カフェにゃんた | sample/猫管理/タマ | sample/猫管理 | タマ | 2歳、活発、♂ |
| 猫カフェにゃんた | sample/設備管理 | sample | 設備管理 | 空調、清掃、備品 |
| 猫カフェにゃんた | sample/予約管理 | sample 1 Variant | 予約・顧客管理 | 予約一覧、会員カード |
シートを作成したら、メニューの「拡張機能」から「Apps Script」を選択してエディタを開きます。
手順は次のとおりです。
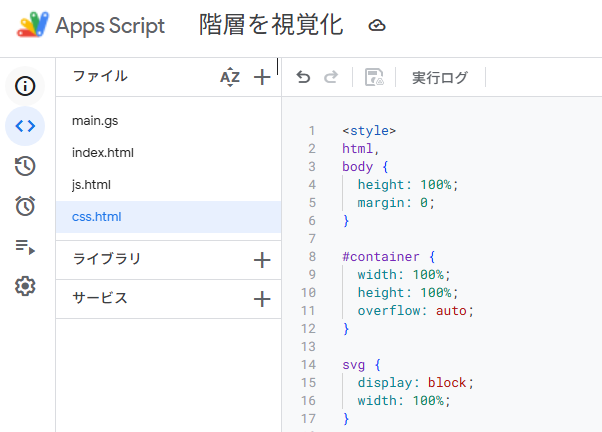
GAS│コードの構成
index.htmlで<svg>を配置js.htmlにスタイル設定を記述js.htmlに D3.js による描画ロジックを記述main.gsでスプレッドシートのデータを取得
コード全文
各ファイルに以下のコードを貼り付けて保存します。
Googleスプレッドシートの関連操作については、まとめのリンクから確認できます。
あわせて読みたい

Googleスプレッドシート・ドライブの使い方まとめ|関数とGAS
Googleの操作を「何をしたいか」から探せるガイドです。 まず標準の画面操作や関数で解決できるかを確認し、繰り返す処理にGASを使います。 目的から手順を選ぶ やりた…
index.html
<!DOCTYPE html>
<html lang="ja">
<head>
  <meta charset="UTF-8">
  <title>階層ビュー</title>
  <meta name="viewport" content="width=device-width, initial-scale=1">
  <script src="https://d3js.org/d3.v7.min.js"></script>
  <link rel="stylesheet" href="https://cdnjs.cloudflare.com/ajax/libs/font-awesome/4.7.0/css/font-awesome.min.css">
  <?!= include("css"); ?>

</head>
  <body>
    <div id="container">
      <svg></svg>
      <div id="tooltip"></div>
    </div>
    <?!= include("js"); ?>
  </body>
</html>
css.html
<style>
html,
body {
  height: 100%;
  margin: 0;
}

#container {
  width: 100%;
  height: 100%;
  overflow: auto;
}

svg {
  display: block;
  width: 100%;
}

#tooltip {
  position: absolute;
  display: none;
  pointer-events: none;
  background: rgba(0, 0, 0, 0.8);
  color: #fff;
  font-size: 12px;
  padding: 4px 8px;
  border-radius: 4px;
  z-index: 1000;
  white-space: pre-wrap;
  max-width: 300px;
}
</style>
js.html
<script type="module">
import * as d3 from "https://cdn.jsdelivr.net/npm/d3@7/+esm";

/* ===== 設定値 ===== */
const sheetUrl =
  "https://docs.google.com/spreadsheets/d/★ここにスプレッドシートのID/gviz/tq?tqx=out:json";
const rectSize = { width: 100, height: 30 };
const space    = { width: 140, height: 60, padding: 30 };
const gap      = { x: 40, y: 60 };

/* ===== スプレッドシート → 階層データ ===== */
const buildTree = (rows) => {
  const map = new Map(), childrenMap = new Map();

  rows.forEach((r) => {
    const nodeId = r.c[1]?.v;
    const parentId = r.c[2]?.v || null;
    const name = r.c[3]?.v;
    const comps = r.c[4]?.v || "";

    if (!nodeId || !name) return;

    map.set(nodeId, {
      name,
      comps,
      children: []
    });

    if (parentId) {
      if (!childrenMap.has(parentId)) childrenMap.set(parentId, []);
      childrenMap.get(parentId).push(nodeId);
    }
  });

  childrenMap.forEach((childIds, pid) => {
    if (!map.has(pid)) return;
    childIds.forEach((cid) => map.get(pid).children.push(map.get(cid)));
  });

  return [...map.keys()].filter(
    id => !rows.some(r => r.c[1]?.v === id && r.c[2]?.v)
  ).map(id => map.get(id));
};

/* ===== 座標計算(Y位置) ===== */
const seekParent = (cur, name) => {
  const hrcy = cur.parent.children;
  const tgt = hrcy.find((c) => c.data.name === name);
  return tgt ? { name, hierarchy: hrcy } : seekParent(cur.parent, name);
};
const calcLeaves = (names, cur) => {
  const hs = names.map((n) => seekParent(cur, n));
  const idxs = hs.map((h) => h.hierarchy.findIndex((d) => d.data.name === h.name));
  const sliced = hs.map((h, i) => h.hierarchy.slice(0, idxs[i]));
  return sliced.flat().map((d) => d.value);
};
const defineY = (d, sp) => {
  const leaves = calcLeaves(d.ancestors().map((a) => a.data.name).slice(0, -1), d);
  return leaves.reduce((s, v) => s + v, 0) * sp.height + sp.padding;
};
const definePos = (root, sp) => {
  root.each((d) => {
    d.x = d.depth * sp.width + sp.padding;
    d.y = defineY(d, sp);
  });
};

/* ===== テキスト自動縮小 ===== */
function fitText(textSel, maxWidth, minFont = 6){
  textSel.each(function(){
    const text = d3.select(this);
    let fontSize = parseInt(text.style("font-size")) || 12;
    while (this.getComputedTextLength() > maxWidth && fontSize > minFont){
      fontSize -= 1;
      text.style("font-size", `${fontSize}px`);
    }
  });
}

/* ===== メイン処理 ===== */
fetch(sheetUrl)
  .then((res) => res.text())
  .then((txt) => JSON.parse(txt.match(/google\.visualization\.Query\.setResponse\((.*)\)/s)[1]))
  .then((json) => {
    const rows = json.table.rows.slice(1);
    const trees = buildTree(rows);

    const svg = d3.select("svg");
    const svgWidth = +svg.attr("width") || window.innerWidth;

    let xOffset = 0, yOffset = 0, rowMaxHeight = 0;

    trees.forEach((data) => {
      const root = d3.hierarchy(data);
      d3.tree()(root);
      root.count();
      definePos(root, space);

      const treeWidth =
        (root.height + 1) * space.width + space.padding * 2;
      const treeHeight =
        root.value * rectSize.height +
        (root.value - 1) * (space.height - rectSize.height) +
        space.padding * 2;

      // 折り返し処理
      if (xOffset + treeWidth > svgWidth) {
        xOffset = 0;
        yOffset += rowMaxHeight + gap.y;
        rowMaxHeight = 0;
      }

      const g = svg.append("g")
        .attr("transform", `translate(${xOffset},${yOffset})`);
      xOffset += treeWidth + gap.x;
      rowMaxHeight = Math.max(rowMaxHeight, treeHeight);

      // エッジ描画
      g.selectAll(".link")
        .data(root.descendants().slice(1))
        .enter()
        .append("path")
        .attr("fill", "none")
        .attr("stroke", "#000")
        .attr("d", (d) => {
          const yC = d.y + rectSize.height / 2;
          const yP = d.parent.y + rectSize.height / 2;
          const xM = d.parent.x + rectSize.width + (space.width - rectSize.width) / 2;
          return `M${d.x},${yC} L${xM},${yC} L${xM},${yP} L${d.parent.x + rectSize.width},${yP}`;
        });

      // ノード描画
      const node = g.selectAll(".node")
        .data(root.descendants())
        .enter()
        .append("g")
        .attr("class", "node")
        .attr("transform", (d) => `translate(${d.x},${d.y})`);

      const tooltip = d3.select("#tooltip");

      node
        .on("mouseenter", (event, d) => {
          tooltip
            .style("display", "block")
            .text(d.data.comps || "(コンポーネントなし)");
        })
        .on("mousemove", (event) => {
          tooltip
            .style("left", `${event.pageX + 10}px`)
            .style("top", `${event.pageY + 10}px`);
        })
        .on("mouseleave", () => {
          tooltip.style("display", "none");
        });

      node.append("rect")
        .attr("width", rectSize.width)
        .attr("height", rectSize.height)
        .attr("fill", "#fff")
        .attr("stroke", "#333");

      const txt = node.append("text")
        .text(d => d.data.name)
        .attr("x", 6)
        .attr("y", 20);

      // ツールチップ追加(SVG標準)
      txt.append("title").text(d => d.data.comps || "(コンポーネントなし)");

      fitText(txt, rectSize.width - 8);
    });

    svg.attr("height", yOffset + rowMaxHeight + space.padding);
  });
</script>
main.gs
function doGet () {
  return HtmlService.createTemplateFromFile('index').evaluate();
}

function getPrefabTreeData() {
  const sheet = SpreadsheetApp.getActiveSpreadsheet().getSheetByName("シート1");//★ここにシート名
  const data = sheet.getDataRange().getValues();
  const headers = data[0];
  const rows = data.slice(1);

  const nodes = [];
  const edges = [];

  const map = {};

  for (let i = 0; i < rows.length; i++) {
    const row = rows[i];
    const nodeId = row[1]?.toString().trim();
    const parentId = row[2]?.toString().trim();
    const name = row[3]?.toString().trim();
    const comps = row[4]?.toString().trim();

    if (!nodeId || !name) continue;

    if (!map[nodeId]) {
      map[nodeId] = {
        id: nodeId,
        parent: parentId || null,
        name: name,
        comps: comps || "",
      };
    }
  }

  return Object.values(map);
}

function include(file) {
  return HtmlService.createHtmlOutputFromFile(file).getContent();
}
コードの配置は以上です。
画面右上の「デプロイ」から「新しいデプロイ」を開き、「ウェブアプリ」としてデプロイします。
発行されたURLにアクセスし、階層構造が正常に表示されるか確認します。
この記事で紹介しているコードは、GitHubのMOTOKI-LLC/cg-method-codeにもまとめています。
GASでシートを操作する記事は、ほかにもあります。
あわせて読みたい

Googleスプレッドシート│2つのシートを自動同期するGASの作り方
スプレッドシートのデータを取得し、後ろの列に備考などの追記情報を管理することがあります。 元データの行が追加や削除によって変動すると、手作業で追記した備考など…
あわせて読みたい

Googleスプレッドシート│GASでスプレッドシートのA1セルの値を取得する方法
本稿はWeb版Googleスプレッドシートの練習表で、操作と結果を確かめる手順を説明します。 A1の値は getRange(“A1”).getValue() で取得します。 ファイル、シート名、セ…
あわせて読みたい

Googleスプレッドシート│テンプレートを日付別に複製&チェックボックス処理も自動化する
Google Apps Script(GAS)を使って、 日付をもとにファイル名を付けて テンプレートのスプレッドシートをコピー チェックボックスの状態を確認 コピーしたファイル内で…
あわせて読みたい

Googleスプレッドシート│不要なシートを一括削除する方法
スプレッドシートのシート数が増えると、不要なシートを1つずつ手作業で削除するのは手間がかかります。 枚数が多いときは、残したいシートだけを指定してGoogle Apps S…
まとめ
- D3.jsとスプレッドシートを組み合わせることで、シート編集のみで保守できる階層ビジュアライザーを構築できます。
- 要件に合わせてカスタマイズすることで、組織図やUI構成図、カテゴリツリーなどの可視化に応用できます。